The
map below indicates U.S. Crude Death Rates by State, 2013-2017, recent five
year span.
- Eastern states (e.g., Michigan and Ohio) tend to have higher death rates than the U.S. crude DR 840.6 indicated by o
- o = red circle indicates state crude death rate is greater than
U.S. crude DR '840.6'. (struggling state). During
recent five year period, 2013-2017, 30 states had a state crude death rate
greater than the U.S. DR 840.6
- Crude DR (Death Rate) = (crude deaths/population) x 100,000 = U.S. crude DR 2013-2017 = ((13,493,792) / (1,605,251,406)) * 100,000 = 840.6
- Crude death is a measure of all deaths for a specified period and age group.

How much did crude deaths increase in the in the U.S. in the recent five year period, 2013-2017, compared to the prior five years, 2008-2012?
The U.S. (United States) had significant 8.5% crude death increase
in the last five year span, 2013-2017 versus the five years prior 2008-2012.
Crude death is
a measure of all death for a specified period and age group.
The U.S. had
significant 8.5% crude death increase - - 1,057,473
more crude deaths in the recent five year span 2013-2017 versus
2008-2012 = 13,493,792 - 12,436,319 = 1,057,473. The United States had
13,493,792 crude deaths in the recent five year period, 2013-2017.
In the 5 year span, 2013-2017, 13,493,792 people
died in the U.S. from a crude death, 64% of
the deaths (8,677,574 deaths) occurred in 15 states: (California,
Florida, Texas, New York, Pennsylvania, Ohio, Illinois, Michigan, North
Carolina, Georgia, New Jersey, Tennessee, Virginia, Indiana and Missouri).

U.S. had significant 8.5% crude death increase - - - - 1,057,473 more crude deaths in the last 5 year span 2013-2017 vs 2008-2012 = 13,493,792 - 12,436,319 = 1,057,473. The United States had 13,493,792 crude deaths in the last 5 years, 2013-2017.
U.S. crude death rate increased significantly 35.7 points comparing recent 5 year crude death rate to prior 5, 2013-2017 vs 2008-2012 death rates = 840.6 - 804.9 = 35.7 crude death rate point increase in the last 5 year period."
DR (Death Rate) = (Crude Death Rate)/Population*100,000.
U.S. Crude DR during 2013-2017 = (Deaths/Population)*100,000 = 840.6 = ((13,493,792) / (1,605,251,406)) * 100,000 = 840.6
Calculation for Percent Change = ((New Value - Old Value)/ Old Value )*100 = 8.5% = U.S. ((2013-2017 Crude deaths - 2008-2012 Crude deaths) /(2008-2012 Crude deaths))*100 = ((13,493,792 - 12,436,319)/(12,436,319))*100 = (1,057,473/12,436,319)*100 = 8.5% crude death increase in the last five year span, 2013-2017 versus the five years prior 2008-2012 .

- 3.1% of crude deaths are between ages 15-34 years old, (414,359 age 15-34 year old crude deaths, in the 5 year span, 2013-2017)
- 13.5% of crude deaths are between ages 0-54 years old, (1,819,866 of crude deaths are between ages 0-54 years old,, in the 5 year span, 2013-2017)
U.S. lost young persons ages 15-34 years old to a crude death at the rate of 227 crude deaths per day during 2013-2017 = 414,359 crude deaths / 5 years = 82871.8 deaths per year / 365 days per year = 227 crude deaths per day during years 2013-2017.
U.S. lost residents to a crude death at the rate of 7,394 crude deaths per day during 2013-2017 = 13,493,792 crude deaths / 5 years = 2698758.4 deaths per year / 365 days per year = 7394 crude deaths per day during years 2013-2017.

Which age group had the largest increase in crude deaths in the U.S. in the last 5 year span 2013-2017 compared to the
prior 5 years?
Answer: The ten-year age group, ages 25-34 years old had significant, 21.6% increase in crude deaths, the largest increase in crude death in the last five year span, 2013-2017 versus the five years prior 2008-2012!

U.S. young people ages 25-34 years old had a 21.6% crude death increase-
- - 46,613 more deaths ages 25-34 years old in the recent five
year period, 2013-2017 versus 2008-2012 = 261,988 - 215,375 = 46,613
more crude deaths in the last 5 year span. U.S. young people ages 25-34
years old had 261,988 crude deaths in the last 5 years, 2013-2017.
U.S young people ages
25-34 years crude death rate increased significantly 14.3
points comparing recent 5 year crude death rate to prior 5
years, 2013-2017 vs 2008-2012 death rates = 118.8 - 104.5 = 14.3 death rate
point increase in the last 5 year period!!!
Note: It
is out of character for this age group, ages 25-34 years old, to have
significant death increase. It is not normal for a young healthy age
group to have a significant death increase.
To understand this significance, a future published report will look at the
prior five year crude deaths 2008-2012 versus the prior five years 2003-2007
for comparison.
Additionally, to understand the impact increased potency mind-altering substances are having on people - a future published report will look at mind-altering substance deaths for this population in the same period. Normally this age group goes up or down a point or two, it should go down considering all the technology and safety electronics we have. A 14.3 death rate point increase, in the last five year period, compared to the prior five year period, is a significant change in crude deaths, a significant increase in young crude deaths, ages 25-34 years old.
Additionally, to understand the impact increased potency mind-altering substances are having on people - a future published report will look at mind-altering substance deaths for this population in the same period. Normally this age group goes up or down a point or two, it should go down considering all the technology and safety electronics we have. A 14.3 death rate point increase, in the last five year period, compared to the prior five year period, is a significant change in crude deaths, a significant increase in young crude deaths, ages 25-34 years old.
Calculation for Percent Change (%Death increase/decrease) = ((New Value - Old Value)/ Old Value )*100 = 21.6% = 25-34 years ((2013-2017 Crude deaths - 2008-2012 Crude deaths ) / (2008-2012 Crude deaths ))*100 = ((261,988 - 215,375) / ( 215,375))*100 = ((46,613) / ( 215,375))*100 = 21.6% crude death increase for ages 25-34 years old.
--------------------------------------------------------------------------
Age Division % Change
--------------------------------------------------------------------------
In U.S., from 2013-2017, we see a significant increase in crude death for persons aged 15-24 years old, compared to earlier age group age 5-14 years old, we see a 463% increase in crude death for persons aged 15-24 years old, compared to earlier age group age 5-14 years old. There were 125,296 more crude deaths age 15-24 year old age group versus the age 5-14 year old age group.
Calculation for percent change is ((New Value - Old Value) / Old Value)*100 = ((Age 15-24 year old crude deaths - Age 5-14 year old crude deaths)/Age 5-14 year old crude deaths)*100 = ((152,371 - 27,075)/27,075)*100= 463% increase in crude deaths for persons aged 15-24 years old compared to earlier age group age 5-14 years old.
--------------------------------------------------------------------------
In the following age group, ages 25-34 years old, we see significant 72% crude death increase in crude death for persons age 25-34 years old, compared to earlier age group ages 15-24 years old, there were 109,617 more crude deaths ages 25-34 year old age group versus the earlier age group, ages 15-24 years old.
Calculation for percent change is ((New Value - Old Value) / Old Value)*100 = ((Ages 25-34 year old crude deaths - Age 15-24 year old crude deaths)/Age 15-24 year old crude deaths)*100 = ((261,988 - 152,371)/152,371)*100 = 72% increase in crude deaths for persons ages 25-34 years old compared to earlier age group age 15-24 years old.
--------------------------------------------------------------------------

What
three states have the highest crude death rates 2013-2017?
States with the highest death rates need the most support.
Answer: West Virginia, Alabama and Main have the highest crude death rates 2013-2017.

During 2013-2017, five year span, 30 states had a crude death rate greater than or equal to the U.S. death rate '840.6', listed worst to best: West Virginia, Alabama, Maine, Arkansas, Mississippi, Kentucky, Pennsylvania, Ohio, Tennessee, Oklahoma, Missouri, South Carolina, Michigan, Louisiana, Montana, Iowa, Indiana, Florida, Rhode Island, Vermont, Delaware, Kansas, South Dakota, Wisconsin, New Hampshire, North Carolina, Oregon, Nebraska, New Mexico, Connecticut, North Dakota.
The table below indicates the 13,493,792 U.S. crude deaths, 2013-2017, 5 year span, sorted by state crude death rate.
Orange indicates the top 15 worst Crude death rates per state population. The red bars to the right indicate crude death volume.
DR (Death Rate) = (Crude Death Rate)/Population*100,000.
U.S. Crude DR during 2013-2017 = (Deaths/Population)*100,000 = 840.6 = ((13,493,792) / (1,605,251,406)) * 100,000 = 840.6
There were 840.6 Crude deaths per 100,000 persons in the U.S. during 2013-2017.
 the Red light indicates a state crude DR is higher "worse" than the U.S. crude DR '840.6'. States that are struggling with crude deaths have a higher DR than the U.S. DR.
Population rank is broken into three categories:
HV = high volume 1-15 = HV
MV = medium volume 16-31 = MV
LV = low volume = 32+ = LV

What are
the top 15 states with the highest crude death rates in the last five year
period, 2013-2017?
Answer: During 2013-2017 the following 15 states have the worst, highest crude death rates. States that are struggling have a crude death rate higher or 'worse than' the U.S. crude DR '840.6'.
Population Rank (1-15=HV, 16-31=MV, 32+= LV). HV= High Volume, MV= Medium Volume, LV = Low Volume.
#1 West Virginia 1226.5
#2 Alabama 1062.7 MV
#3 Maine 1057.7
#4 Arkansas 1053.
#5 Mississippi 1050.6
#6 Kentucky 1045. MV
#7 Pennsylvania 1030.2 HV
#8 Ohio 1014.9 HV
#9 Tennessee 1007.5 MV
#10 Oklahoma 1005.4 MV
#11 Missouri 978.3 MV
#12 South Carolina 958.8 MV
#13 Michigan 957.9 HV
#14 Louisiana 947.9 MV
#15 Montana 947.6
States that have high death rates, need critical support to investigate counties where this is happening, to understand what is causing this high death increase to develop strategies to support good health and prevent early death. (County reports will be out ASAP)
The
chart below sorts U.S. Crude Deaths, 2013-2017, 5 year span, by state crude
death volume.
64% of deaths occurred in 15 states.
What
state had the highest crude death increase in the last five year span,
2013-2017, compared to the five years prior 2008-2012?
Answer: Utah had a 16.9% crude death increase, the highest crude death increase 2013-2017.
Utah had a 16.9% crude death increase - - - - 12,471 more crude deaths in the last 5 year span vs prior 5 years, 2013-2017 vs 2008-2012 = 86,367 - 73,896 = 12,471 more crude deaths in the last 5 year span. Utah had 86,367 crude deaths in the last 5 years, 2013-2017.
Utah crude death rate increased significantly, 41.5 points, comparing recent the five year crude death rate to the prior five years, 2013-2017 versus 2008-2012 death rates = 576.1 - 534.6 = 41.5 death rate point increase in the last 5 year period.
Calculation for Percent Change (crude death increase) = ((New Value - Old Value)/ Old Value )*100 = 16.9% = Utah ((2013-2017 Crude deaths - 2008-2012 Crude deaths ) / (2008-2012 Crude deaths ))*100 = ((86,367 - 73,896) / ( 73,896))*100 = ((12,471) / ( 73,896))*100 = 16.9%

What are
the top 15 states with the highest crude death increase in the last five
year span, 2013-2017, compared to the five years prior 2008-2012?

The
table below indicates states with sorts states descending from highest death increase to lowest. This table compares the recent five year crude deaths to the prior five years,
2013-2017 vs 2008-2012, sorted by state
crude death percent change (crude death increase/decrease).
Calculation for Percent Change = ((New Value - Old Value)/ Old Value )*100 = ((2013-2017 crude deaths - 2008-2012 crude deaths ) / (2008-2012 crude deaths ))*100
Dark Red Highlight indicates state death increase in the table below. States that have high death increase, need critical support to investigate counties where this is happening, to understand what is causing this high death increase to develop strategies to support good health and prevent early death. (County reports will be out ASAP)

The map below indicates U.S. Crude Death Rates by State, 2013-2017, last five year span.
The map below indicates U.S. Crude Death Rates by State, 2013-2017, last five year span.
Almost all red on Eastern side of U.S., the Michigan and New York side (indicating higher death rates, greater than U.S. average)
Eastern states (e.g., Michigan and Ohio) tend to have higher death rates than the U.S. crude DR 840.6 indicated by o
o = red circle indicates state crude death rate is greater than U.S. crude DR 840.6. States that are struggling with crude deaths have a higher crude DR (Death Rate) than the U.S. crude DR.
Crude DR (Death Rate) = (crude deaths/population) x 100,000
U.S. crude DR 2013-2017 = ((13,493,792) / (1,605,251,406)) * 100,000 = 840.6
2013-2017, 30 states had a state crude death rate greater than the U.S. DR 840.6


Colorado
had significant a 13.3% crude death increase - - - - 21,283 more crude
deaths in the last 5 year span vs prior 5 years, 2013-2017 vs 2008-2012 = 180,891 - 159,608
= 21,283 more crude deaths in the last 5 year span. Colorado had 180,891
crude deaths in the last 5 years, 2013-2017.
Colorado crude death rate increased significantly 30.9 points comparing recent 5 year crude death rate to prior 5, 2013-2017 vs 2008-2012 death rates = 664.3 - 633.5 = 30.9 death rate point increase in the last 5 yr period.
Calculation for Percent Change = ((New Value - Old Value)/ Old Value )*100 = 13.3% =
Colorado ((2013-2017
Crude deaths - 2008-2012 Crude deaths ) / (2008-2012 Crude deaths ))*100
= ((180,891 - 159,608) / ( 159,608))*100 = ((21,283) / ( 159,608))*100
= 13.3%
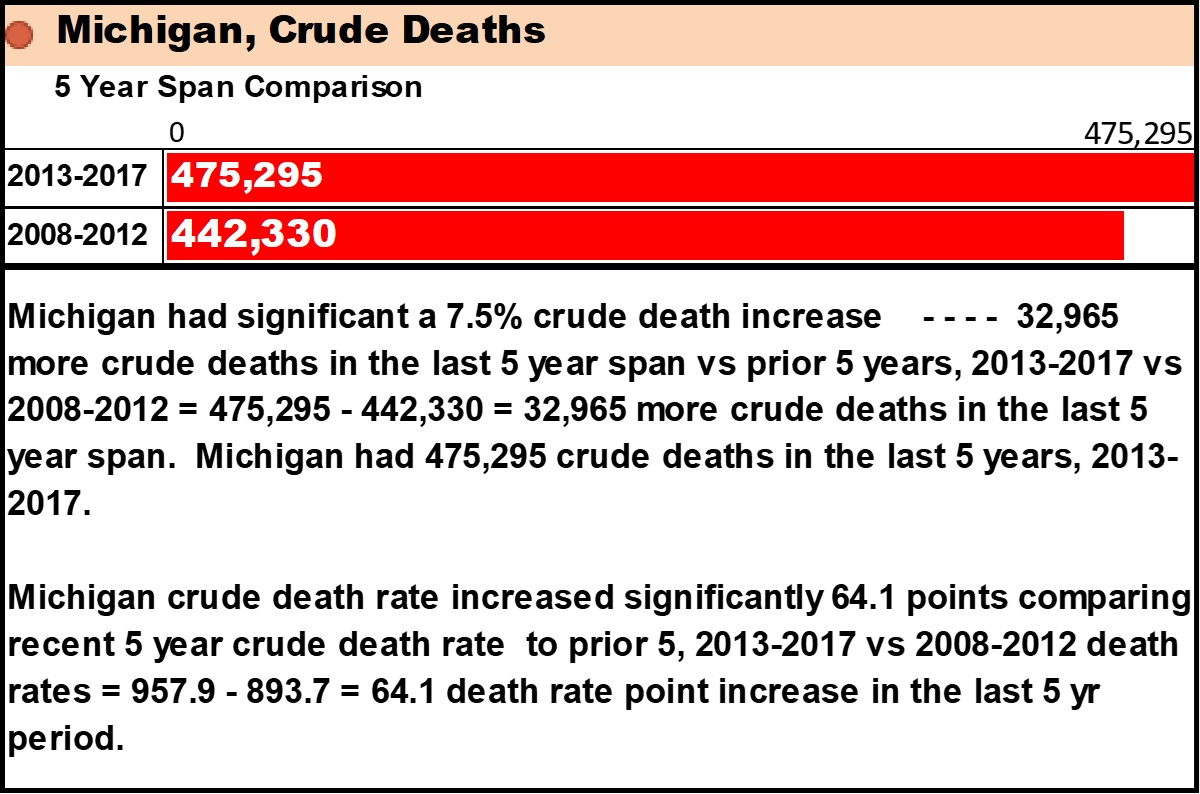
Michigan had significant a 7.5% crude death increase - - 32,965 more crude deaths in the last 5 year span vs prior 5 years, 2013-2017 vs 2008-2012 = 475,295 - 442,330 = 32,965 more crude deaths in the last 5 year span. Michigan had 475,295 crude deaths in the last 5 years, 2013-2017.
Michigan crude death rate increased significantly 64.1 points comparing recent 5 year crude death rate to prior 5, 2013-2017 vs 2008-2012 death rates = 957.9 - 893.7 = 64.1 death rate point increase in the last 5 yr period.
Calculation for Percent Change = ((New Value - Old Value)/ Old Value )*100 = 7.5% =
Michigan ((2013-2017 Crude deaths - 2008-2012 Crude deaths ) / (2008-2012 Crude deaths ))*100 = ((475,295 - 442,330) / ( 442,330))*100 = ((32,965) / ( 442,330))*100 = 7.5%

Arizona had a 14.6% crude death increase - - - - 34,443 more crude deaths in the last 5 year span vs prior 5 years, 2013-2017 vs 2008-2012 = 270,774 - 236,331 = 34,443 more crude deaths in the last 5 year span. Arizona had 270,774 crude deaths in the last 5 years, 2013-2017.
Arizona crude death rate increased 55.9 points comparing recent 5 year crude death rate to prior 5, 2013-2017 vs 2008-2012 death rates = 793.3 - 737.4 = 55.9 death rate point increase in the last 5 yr period."
Calculation for Percent Change = ((New Value - Old Value)/ Old Value )*100 = 14.6% =
Arizona ((2013-2017 Crude deaths - 2008-2012 Crude deaths ) / (2008-2012 Crude deaths ))*100 = ((270,774 - 236,331) / ( 236,331))*100 = ((34,443) / ( 236,331))*100 = 14.6

Arkansas had significant a 6.9% crude death increase - - - - 10,184 more crude deaths in the last 5 year span vs prior 5 years, 2013-2017 vs 2008-2012 = 156,865 - 146,681 = 10,184 more crude deaths in the last 5 year span. Arkansas had 156,865 crude deaths in the last 5 years, 2013-2017.
Arkansas crude death rate increased significantly 46.6 points comparing recent 5 year crude death rate to prior 5, 2013-2017 vs 2008-2012 death rates = 1053. - 1006.4 = 46.6 death rate point increase in the last 5 yr period."
Calculation for Percent Change = ((New Value - Old Value)/ Old Value )*100 = 6.9% =
Arkansas ((2013-2017 Crude deaths - 2008-2012 Crude deaths ) / (2008-2012 Crude deaths ))*100 = ((156,865 - 146,681) / ( 146,681))*100 = ((10,184) / ( 146,681))*100 = 6.9%"

California had significant a 8.4% crude death increase - - - - 99,913 more crude deaths in the last 5 year span vs prior 5 years, 2013-2017 vs 2008-2012 = 1,283,923 - 1,184,010 = 99,913 more crude deaths in the last 5 year span. California had 1,283,923 crude deaths in the last 5 years, 2013-2017.
California crude death rate increased significantly 23.5 points comparing recent 5 year crude death rate to prior 5, 2013-2017 vs 2008-2012 death rates = 658.2 - 634.7 = 23.5 death rate point increase in the last 5 yr period."
Calculation for Percent Change = ((New Value - Old Value)/ Old Value )*100 = 8.4% =
California ((2013-2017 Crude deaths - 2008-2012 Crude deaths ) / (2008-2012 Crude deaths ))*100 = ((1,283,923 - 1,184,010) / ( 1,184,010))*100 = ((99,913) / ( 1,184,010))*100 = 8.4%"

Connecticut had a 4.8% crude death increase - - - - 6,969 more crude deaths in the last 5 year span vs prior 5 years, 2013-2017 vs 2008-2012 = 151,882 - 144,913 = 6,969 more crude deaths in the last 5 year span. Connecticut had 151,882 crude deaths in the last 5 years, 2013-2017.
Connecticut crude death rate increased significantly 34.5 points comparing recent 5 year crude death rate to prior 5, 2013-2017 vs 2008-2012 death rates = 846.2 - 811.7 = 34.5 death rate point increase in the last 5 yr period."
Calculation for Percent Change = ((New Value - Old Value)/ Old Value )*100 = 4.8% = Connecticut ((2013-2017 Crude deaths - 2008-2012 Crude deaths ) / (2008-2012 Crude deaths ))*100 = ((151,882 - 144,913) / ( 144,913))*100 = ((6,969) / ( 144,913))*100 = 4.8%

Delaware had a 11.1% crude death increase - - - - 4,279 more crude deaths in the last 5 year span vs prior 5 years, 2013-2017 vs 2008-2012 = 42,861 - 38,582 = 4,279 more crude deaths in the last 5 year span. Delaware had 42,861 crude deaths in the last 5 years, 2013-2017.
Delaware crude death rate increased 50 points comparing recent 5 year crude death rate to prior 5, 2013-2017 vs 2008-2012 death rates = 907.8 - 857.8 = 50. crude death rate point increase in the last 5 year period, 2013-2017 vs 2008-2012.
Calculation for Percent Change = ((New Value - Old Value)/ Old Value )*100 = 11.1% =
Delaware ((2013-2017 Crude deaths - 2008-2012 Crude deaths ) / (2008-2012 Crude deaths ))*100 = ((42,861 - 38,582) / ( 38,582))*100 = ((4,279) / ( 38,582))*100 = 11.1%"

District of Columbia had a 1.8% crude death increase - - - - 430 more crude deaths in the last 5 year span vs prior 5 years, 2013-2017 vs 2008-2012 = 24,315 - 23,885 = 430 more crude deaths in the last 5 year span. District of Columbia had 24,315 crude deaths in the last 5 years, 2013-2017.
District of Columbia crude death rate decreased -64.5 points comparing recent 5 year crude death rate to prior 5, 2013-2017 vs 2008-2012 death rates = 725.2 - 789.7 = -64.5 death rate point increase in the last 5 yr period."
Calculation for Percent Change = ((New Value - Old Value)/ Old Value )*100 = 1.8% =
District of Columbia ((2013-2017 Crude deaths - 2008-2012 Crude deaths ) / (2008-2012 Crude deaths ))*100 = ((24,315 - 23,885) / ( 23,885))*100 = ((430) / ( 23,885))*100 = 1.8%

Florida had a 10.9% crude death increase - - - - 94,069 more crude deaths in the last 5 year span vs prior 5 years, 2013-2017 vs 2008-2012 = 959,754 - 865,685 = 94,069 more crude deaths in the last 5 year span. Florida had 959,754 crude deaths in the last 5 years, 2013-2017.
Florida crude death rate increased 29.8 points comparing recent 5 year crude death rate to prior 5, 2013-2017 vs 2008-2012 death rates = 947.3 - 917.5 = 29.8 death rate point increase in the last 5 yr period.
Calculation for Percent Change = ((New Value - Old Value)/ Old Value )*100 = 10.9% =
Florida ((2013-2017 Crude deaths - 2008-2012 Crude deaths ) / (2008-2012 Crude deaths ))*100 = ((959,754 - 865,685) / ( 865,685))*100 = ((94,069) / ( 865,685))*100 = 10.9%

Georgia had a 11.8% crude death increase - - - - 41,733 more crude deaths in the last 5 year span versus prior 5 years, 2013-2017 versus 2008-2012 = 396,443 - 354,710 = 41,733 more crude deaths in the last 5 year span. Georgia had 396,443 crude deaths in the last 5 years, 2013-2017.
Georgia crude death rate increased 46 points comparing recent 5 year crude death rate to prior 5, 2013-2017 versus 2008-2012 death rates = 776.7 - 730.6 = 46. death rate point increase in the last 5 year period.
Calculation for Percent Change = ((New Value - Old Value)/ Old Value )*100 = 11.8% =
Georgia ((2013-2017 Crude deaths - 2008-2012 Crude deaths ) / (2008-2012 Crude deaths ))*100 = ((396,443 - 354,710) / ( 354,710))*100 = ((41,733) / ( 354,710))*100 = 11.8%

Hawaii had a 11.% crude death increase - - - - 5,399 more crude deaths in the last 5 year span versus prior 5 years, 2013-2017 versus 2008-2012 = 54,628 - 49,229 = 5,399 more crude deaths in the last 5 year span. Hawaii had 54,628 crude deaths in the last 5 years, 2013-2017.
Hawaii crude death rate increased 44.9 points comparing recent 5 year crude death rate to prior 5, 2013-2017 versus 2008-2012 death rates = 768.2 - 723.3 = 44.9 death rate point increase in the last 5 year period.
Calculation for Percent Change = ((New Value - Old Value)/ Old Value )*100 = 11.% =
Hawaii ((2013-2017 Crude deaths - 2008-2012 Crude deaths ) / (2008-2012 Crude deaths ))*100 = ((54,628 - 49,229) / ( 49,229))*100 = ((5,399) / ( 49,229))*100 = 11.%

Idaho had a 13.8% crude death increase - - 7,936 more crude deaths in the last 5 year span versus prior 5 years, 2013-2017 versus 2008-2012 = 65,450 - 57,514 = 7,936 more crude deaths in the last 5 year span. Idaho had 65,450 crude deaths in the last 5 years, 2013-2017.
Idaho crude death rate increased significantly 54.5 points comparing recent 5 year crude death rate to prior 5, 2013-2017 versus 2008-2012 death rates = 788.4 - 733.9 = 54.5 death rate point increase in the last 5 year period."
Calculation for Percent Change = ((New Value - Old Value)/ Old Value )*100 = 13.8% =
Idaho ((2013-2017 Crude deaths - 2008-2012 Crude deaths ) / (2008-2012 Crude deaths ))*100 = ((65,450 - 57,514) / ( 57,514))*100 = ((7,936) / ( 57,514))*100 = 13.8%"

Illinois had a 4.8% crude death increase - - 24,510 more crude deaths in the last 5 year span versus prior 5 years, 2013-2017 versus 2008-2012 = 532,307 - 507,797 = 24,510 more crude deaths in the last 5 year span. Illinois had 532,307 crude deaths in the last 5 years, 2013-2017.
Illinois crude death rate increased significantly 36.8 points comparing recent 5 year crude death rate to prior 5, 2013-2017 versus 2008-2012 death rates = 828.8 - 792. = 36.8 death rate point increase in the last 5 year period."
Calculation for Percent Change = ((New Value - Old Value)/ Old Value )*100 = 4.8% =
Illinois ((2013-2017 Crude deaths - 2008-2012 Crude deaths ) / (2008-2012 Crude deaths ))*100 = ((532,307 - 507,797) / ( 507,797))*100 = ((24,510) / ( 507,797))*100 = 4.8%"

Indiana had a 9.2% crude death increase - - 26,437 more crude deaths in the last 5 year span versus prior 5 years, 2013-2017 versus 2008-2012 = 313,439 - 287,002 = 26,437 more crude deaths in the last 5 year span. Indiana had 313,439 crude deaths in the last 5 years, 2013-2017.
Indiana crude death rate increased significantly 62.1 points comparing recent 5 year crude death rate to prior 5, 2013-2017 versus 2008-2012 death rates = 947.3 - 885.2 = 62.1 death rate point increase in the last 5 year period."
Calculation for Percent Change = ((New Value - Old Value)/ Old Value )*100 = 9.2% =
Indiana ((2013-2017 Crude deaths - 2008-2012 Crude deaths ) / (2008-2012 Crude deaths ))*100 = ((313,439 - 287,002) / ( 287,002))*100 = ((26,437) / ( 287,002))*100 = 9.2%

Iowa had a 5.3% crude death increase - - 7,403 more crude deaths in the last 5 year span versus prior 5 years, 2013-2017 versus 2008-2012 = 147,806 - 140,403 = 7,403 more crude deaths in the last 5 year span. Iowa had 147,806 crude deaths in the last 5 years, 2013-2017.
Iowa crude death rate increased significantly 25.6 points comparing recent 5 year crude death rate to prior 5, 2013-2017 versus 2008-2012 death rates = 947.4 - 921.7 = 25.6 death rate point increase in the last 5 year period.
Calculation for Percent Change = ((New Value - Old Value)/ Old Value )*100 = 5.3% = Iowa ((2013-2017 Crude deaths - 2008-2012 Crude deaths ) / (2008-2012 Crude deaths ))*100 = ((147,806 - 140,403) / ( 140,403))*100 = ((7,403) / ( 140,403))*100 = 5.3%"

Kansas had a 6% crude death increase - - 7,417 more crude deaths in the last 5 year span versus prior 5 years, 2013-2017 versus 2008-2012 = 131,179 - 123,762 = 7,417 more crude deaths in the last 5 year span. Kansas had 131,179 crude deaths in the last 5 years, 2013-2017.
Kansas crude death rate increased significantly 34.4 points comparing recent 5 year crude death rate to prior 5, 2013-2017 versus 2008-2012 death rates = 902.8 - 868.4 = 34.4 death rate point increase in the last 5 year period.
Calculation for Percent Change = ((New Value - Old Value)/ Old Value )*100 = 6.% =
Kansas ((2013-2017 Crude deaths - 2008-2012 Crude deaths ) / (2008-2012 Crude deaths ))*100 = ((131,179 - 123,762) / ( 123,762))*100 = ((7,417) / ( 123,762))*100 = 6.%"

Kentucky had a 9.6% crude death increase - - 20,218 more crude deaths in the last 5 year span versus prior 5 years, 2013-2017 versus 2008-2012 = 231,200 - 210,982 = 20,218 more crude deaths in the last 5 year span. Kentucky had 231,200 crude deaths in the last 5 years, 2013-2017.
Kentucky crude death rate increased significantly 72.5 points comparing recent 5 year crude death rate to prior 5, 2013-2017 versus 2008-2012 death rates = 1045. - 972.4 = 72.5 death rate point increase in the last 5 year period.
Calculation for Percent Change = ((New Value - Old Value)/ Old Value )*100 = 9.6% =
Kentucky ((2013-2017 Crude deaths - 2008-2012 Crude deaths ) / (2008-2012 Crude deaths ))*100 = ((231,200 - 210,982) / ( 210,982))*100 = ((20,218) / ( 210,982))*100 = 9.6%

Louisiana had a 7.6% crude death increase - - 15,586 more crude deaths in the last 5 year span versus prior 5 years, 2013-2017 versus 2008-2012 = 220,965 - 205,379 = 15,586 more crude deaths in the last 5 year span. Louisiana had 220,965 crude deaths in the last 5 years, 2013-2017.
Louisiana crude death rate increased significantly 40.6 points comparing recent 5 year crude death rate to prior 5, 2013-2017 versus 2008-2012 death rates = 947.9 - 907.3 = 40.6 death rate point increase in the last 5 year period.
Calculation for Percent Change = ((New Value - Old Value)/ Old Value )*100 = 7.6% = Louisiana ((2013-2017 Crude deaths - 2008-2012 Crude deaths ) / (2008-2012 Crude deaths ))*100 = ((220,965 - 205,379) / ( 205,379))*100 = ((15,586) / ( 205,379))*100 = 7.6%

Maine had a 10.4% crude death increase - - 6,638 more crude deaths in the last 5 year span versus prior 5 years, 2013-2017 versus 2008-2012 = 70,394 - 63,756 = 6,638 more crude deaths in the last 5 year span. Maine had 70,394 crude deaths in the last 5 years, 2013-2017. Maine had a 10.4% crude death increase - - 6,638 more crude deaths in the last 5 year span
Maine crude death rate increased significantly 98.4 points comparing recent 5 year crude death rate to prior 5, 2013-2017 versus 2008-2012 death rates = 1057.7 - 959.3 = 98.4 death rate point increase in the last 5 year period.
Calculation for Percent Change = ((New Value - Old Value)/ Old Value )*100 = 10.4% = Maine ((2013-2017 Crude deaths - 2008-2012 Crude deaths ) / (2008-2012 Crude deaths ))*100 = ((70,394 - 63,756) / ( 63,756))*100 = ((6,638) / ( 63,756))*100 = 10.4%

Maryland had a 8.3% crude death increase - - 18,271 more crude deaths in the last 5 year span versus prior 5 years, 2013-2017 versus 2008-2012 = 237,553 - 219,282 = 18,271 more crude deaths in the last 5 year span. Maryland had 237,553 crude deaths in the last 5 years, 2013-2017.
Maryland crude death rate increased significantly 33.6 points comparing recent 5 year crude death rate to prior 5, 2013-2017 versus 2008-2012 death rates = 792.4 - 758.7 = 33.6 death rate point increase in the last 5 year period.
Calculation for Percent Change = ((New Value - Old Value)/ Old Value )*100 = 8.3% = Maryland ((2013-2017 Crude deaths - 2008-2012 Crude deaths ) / (2008-2012 Crude deaths ))*100 = ((237,553 - 219,282) / ( 219,282))*100 = ((18,271) / ( 219,282))*100 = 8.3%

Massachusetts had a 6.8% crude death increase - - 18,041 more crude deaths in the last 5 year span versus prior 5 years, 2013-2017 versus 2008-2012 = 283,337 - 265,296 = 18,041 more crude deaths in the last 5 year span. Massachusetts had 283,337 crude deaths in the last 5 years, 2013-2017.
Massachusetts crude death rate increased significantly 26.1 points comparing recent 5 year crude death rate to prior 5, 2013-2017 versus 2008-2012 death rates = 835.7 - 809.6 = 26.1 death rate point increase in the last 5 year period.
Calculation for Percent Change = ((New Value - Old Value)/ Old Value )*100 = 6.8% = Massachusetts ((2013-2017 Crude deaths - 2008-2012 Crude deaths ) / (2008-2012 Crude deaths ))*100 = ((283,337 - 265,296) / ( 265,296))*100 = ((18,041) / ( 265,296))*100 = 6.8%

Minnesota had a 9% crude death increase - - 17,523 more crude deaths in the last 5 year span versus prior 5 years, 2013-2017 versus 2008-2012 = 212,681 - 195,158 = 17,523 more crude deaths in the last 5 year span. Minnesota had 212,681 crude deaths in the last 5 years, 2013-2017.
Minnesota crude death rate increased significantly 39.5 points comparing recent 5 year crude death rate to prior 5, 2013-2017 versus 2008-2012 death rates = 774.4 - 734.9 = 39.5 death rate point increase in the last 5 year period.
Calculation for Percent Change = ((New Value - Old Value)/ Old Value )*100 = 9% = Minnesota ((2013-2017 Crude deaths - 2008-2012 Crude deaths ) / (2008-2012 Crude deaths ))*100 = ((212,681 - 195,158) / ( 195,158))*100 = ((17,523) / ( 195,158))*100 = 9%

Mississippi had a 8.3% crude death increase - - 12,018 more crude deaths in the last 5 year span versus prior 5 years, 2013-2017 versus 2008-2012 = 157,064 - 145,046 = 12,018 more crude deaths in the last 5 year span. Mississippi had 157,064 crude deaths in the last 5 years, 2013-2017.
Mississippi crude death rate increased significantly 73 points comparing recent 5 year crude death rate to prior 5, 2013-2017 versus 2008-2012 death rates = 1050.6 - 977.6 = 73. death rate point increase in the last 5 year period.
Calculation for Percent Change = ((New Value - Old Value)/ Old Value )*100 = 8.3% = Mississippi ((2013-2017 Crude deaths - 2008-2012 Crude deaths ) / (2008-2012 Crude deaths ))*100 = ((157,064 - 145,046) / ( 145,046))*100 = ((12,018) / ( 145,046))*100 = 8.3%

Missouri had a 6.9% crude death increase - - 19,320 more crude deaths in the last 5 year span versus prior 5 years, 2013-2017 versus 2008-2012 = 297,384 - 278,064 = 19,320 more crude deaths in the last 5 year span. Missouri had 297,384 crude deaths in the last 5 years, 2013-2017.
Missouri crude death rate increased significantly 48.5 points comparing recent 5 year crude death rate to prior 5, 2013-2017 versus 2008-2012 death rates = 978.3 - 929.8 = 48.5 death rate point increase in the last 5 year period.
Calculation for Percent Change = ((New Value - Old Value)/ Old Value )*100 = 6.9% = Missouri ((2013-2017 Crude deaths - 2008-2012 Crude deaths ) / (2008-2012 Crude deaths ))*100 = ((297,384 - 278,064) / ( 278,064))*100 = ((19,320) / ( 278,064))*100 = 6.9%

Montana had a 9.8% crude death increase - - 4,378 more crude deaths in the last 5 year span versus prior 5 years, 2013-2017 versus 2008-2012 = 48,939 - 44,561 = 4,378 more crude deaths in the last 5 year span. Montana had 48,939 crude deaths in the last 5 years, 2013-2017.
Montana crude death rate increased significantly 47.9 points comparing recent 5 year crude death rate to prior 5, 2013-2017 versus 2008-2012 death rates = 947.6 - 899.6 = 47.9 death rate point increase in the last 5 year period."
Calculation for Percent Change = ((New Value - Old Value)/ Old Value )*100 = 9.8% = Montana ((2013-2017 Crude deaths - 2008-2012 Crude deaths ) / (2008-2012 Crude deaths ))*100 = ((48,939 - 44,561) / ( 44,561))*100 = ((4,378) / ( 44,561))*100 = 9.8%

Nebraska had a 6.5% crude death increase - - 4,990 more crude deaths in the last 5 year span versus prior 5 years, 2013-2017 versus 2008-2012 = 81,567 - 76,577 = 4,990 more crude deaths in the last 5 year span. Nebraska had 81,567 crude deaths in the last 5 years, 2013-2017.
Nebraska crude death rate increased significantly 22.6 points comparing recent 5 year crude death rate to prior 5, 2013-2017 versus 2008-2012 death rates = 861. - 838.4 = 22.6 death rate point increase in the last 5 year period.
Calculation for Percent Change = ((New Value - Old Value)/ Old Value )*100 = 6.5% Nebraska ((2013-2017 Crude deaths - 2008-2012 Crude deaths ) / (2008-2012 Crude deaths ))*100 = ((81,567 - 76,577) / ( 76,577))*100 = ((4,990) / ( 76,577))*100 = 6.5%

Nevada had a 15.5% crude death increase - - 15,389 more crude deaths in the last 5 year span versus prior 5 years, 2013-2017 versus 2008-2012 = 114,699 - 99,310 = 15,389 more crude deaths in the last 5 year span. Nevada had 114,699 crude deaths in the last 5 years, 2013-2017.
Nevada crude death rate increased significantly 58.8 points comparing recent 5 year crude death rate to prior 5, 2013-2017 versus 2008-2012 death rates = 793.3 - 734.5 = 58.8 death rate point increase in the last 5 year period.
Calculation for Percent Change = ((New Value - Old Value)/ Old Value )*100 = 15.5% = Nevada ((2013-2017 Crude deaths - 2008-2012 Crude deaths ) / (2008-2012 Crude deaths ))*100 = ((114,699 - 99,310) / ( 99,310))*100 = ((15,389) / ( 99,310))*100 = 15.5%

New Hampshire had a 13.4% crude death increase - - 6,982 more crude deaths in the last 5 year span versus prior 5 years, 2013-2017 versus 2008-2012 = 59,104 - 52,122 = 6,982 more crude deaths in the last 5 year span. New Hampshire had 59,104 crude deaths in the last 5 years, 2013-2017.
New Hampshire crude death rate increased significantly 96.4 points comparing recent 5 year crude death rate to prior 5, 2013-2017 versus 2008-2012 death rates = 887.7 - 791.2 = 96.4 death rate point increase in the last 5 year period.
Calculation for Percent Change = ((New Value - Old Value)/ Old Value )*100 = 13.4% = New Hampshire ((2013-2017 Crude deaths - 2008-2012 Crude deaths ) / (2008-2012 Crude deaths ))*100 = ((59,104 - 52,122) / ( 52,122))*100 = ((6,982) / ( 52,122))*100 = 13.4%

New Jersey had a 4% crude death increase - - 14,101 more crude deaths in the last 5 year span versus prior 5 years, 2013-2017 versus 2008-2012 = 362,991 - 348,890 = 14,101 more crude deaths in the last 5 year span. New Jersey had 362,991 crude deaths in the last 5 years, 2013-2017.
New Jersey crude death rate increased significantly 17.3 points comparing recent 5 year crude death rate to prior 5, 2013-2017 versus 2008-2012 death rates = 811.2 - 793.9 = 17.3 death rate point increase in the last 5 year period.
Calculation for Percent Change = ((New Value - Old Value)/ Old Value )*100 = 4% = New Jersey ((2013-2017 Crude deaths - 2008-2012 Crude deaths ) / (2008-2012 Crude deaths ))*100 = ((362,991 - 348,890) / ( 348,890))*100 = ((14,101) / ( 348,890))*100 = 4%

New Mexico had a 10.4% crude death increase - - 8,366 more crude deaths in the last 5 year span versus prior 5 years, 2013-2017 versus 2008-2012 = 89,107 - 80,741 = 8,366 more crude deaths in the last 5 year span. New Mexico had 89,107 crude deaths in the last 5 years, 2013-2017.
New Mexico crude death rate increased significantly 68.9 points comparing recent 5 year crude death rate to prior 5, 2013-2017 versus 2008-2012 death rates = 854.7 - 785.8 = 68.9 death rate point increase in the last 5 year period.
Calculation for Percent Change = ((New Value - Old Value)/ Old Value )*100 = 10.4% = New Mexico ((2013-2017 Crude deaths - 2008-2012 Crude deaths ) / (2008-2012 Crude deaths ))*100 = ((89,107 - 80,741) / ( 80,741))*100 = ((8,366) / ( 80,741))*100 =
10.4%

New York had a 3.3% crude death increase - - 24,437 more crude deaths in the last 5 year span versus prior 5 years, 2013-2017 versus 2008-2012 = 764,207 - 739,770 = 24,437 more crude deaths in the last 5 year span. New York had 764,207 crude deaths in the last 5 years, 2013-2017.
New York crude death rate increased 10.4 points comparing recent 5 year crude death rate to prior 5, 2013-2017 versus 2008-2012 death rates = 773.6 - 763.2 = 10.4 death rate point increase in the last 5 year period.
Calculation for Percent Change = ((New Value - Old Value)/ Old Value )*100 = 3.3% =
New York ((2013-2017 Crude deaths - 2008-2012 Crude deaths ) / (2008-2012 Crude deaths ))*100 = ((764,207 - 739,770) / ( 739,770))*100 = ((24,437) / ( 739,770))*100 = 3.3%

North Carolina had a 11.8% crude death increase - - 46,471 more crude deaths in the last 5 year span versus prior 5 years, 2013-2017 versus 2008-2012 = 441,451 - 394,980 = 46,471 more crude deaths in the last 5 year span. North Carolina had 441,451 crude deaths in the last 5 years, 2013-2017.
North Carolina crude death rate increased significantly 50.4 points comparing recent 5 year crude death rate to prior 5, 2013-2017 versus 2008-2012 death rates = 878.4 - 828. = 50.4 death rate point increase in the last 5 year period.
Calculation for Percent Change = ((New Value - Old Value)/ Old Value )*100 = 11.8% = North Carolina ((2013-2017 Crude deaths - 2008-2012 Crude deaths ) / (2008-2012 Crude deaths ))*100 = ((441,451 - 394,980) / ( 394,980))*100 = ((46,471) / ( 394,980))*100 = 11.8%

North Dakota had a 5.3% crude death increase - - 1,565 more crude deaths in the last 5 year span versus prior 5 years, 2013-2017 versus 2008-2012 = 31,297 - 29,732 = 1,565 more crude deaths in the last 5 year span. North Dakota had 31,297 crude deaths in the last 5 years, 2013-2017.
North Dakota crude death rate decreased -41.6 points comparing recent 5 year crude death rate to prior 5, 2013-2017 versus 2008-2012 death rates = 838.4 - 880. = -41.6 death rate point increase in the last 5 year period.
Calculation for Percent Change = ((New Value - Old Value)/ Old Value )*100 = 5.3% = North Dakota ((2013-2017 Crude deaths - 2008-2012 Crude deaths ) / (2008-2012 Crude deaths ))*100 = ((31,297 - 29,732) / ( 29,732))*100 = ((1,565) / ( 29,732))*100 = 5.3%

Oklahoma had a 7% crude death increase - - 12,809 more crude deaths in the last 5 year span versus prior 5 years, 2013-2017 versus 2008-2012 = 195,998 - 183,189 = 12,809 more crude deaths in the last 5 year span. Oklahoma had 195,998 crude deaths in the last 5 years, 2013-2017.
Oklahoma crude death rate increased 28.1 points comparing recent 5 year crude death rate to prior 5, 2013-2017 versus 2008-2012 death rates = 1005.4 - 977.3 = 28.1 death rate point increase in the last 5 year period.
Calculation for Percent Change = ((New Value - Old Value)/ Old Value )*100 = Oklahoma ((2013-2017 Crude deaths - 2008-2012 Crude deaths ) / (2008-2012 Crude deaths ))*100 = ((195,998 - 183,189) / ( 183,189))*100 = ((12,809) / ( 183,189))*100 = 7%

Oregon had a 9.4% crude death increase - - 15,157 more crude deaths in the last 5 year span versus prior 5 years, 2013-2017 versus 2008-2012 = 176,197 - 161,040 = 15,157 more crude deaths in the last 5 year span. Oregon had 176,197 crude deaths in the last 5 years, 2013-2017.
Oregon crude death rate increased significantly 34.1 points comparing recent 5 year crude death rate to prior 5, 2013-2017 versus 2008-2012 death rates = 873.8 - 839.6 = 34.1 death rate point increase in the last 5 year period.
Calculation for Percent Change = ((New Value - Old Value)/ Old Value )*100 = 9.4% =
Oregon ((2013-2017 Crude deaths - 2008-2012 Crude deaths ) / (2008-2012 Crude deaths ))*100 = ((176,197 - 161,040) / ( 161,040))*100 = ((15,157) / ( 161,040))*100 = 9.4%

Pennsylvania had a 4.2% crude death increase - - 26,795 more crude deaths in the last 5 year span versus prior 5 years, 2013-2017 versus 2008-2012 = 658,851 - 632,056 = 26,795 more crude deaths in the last 5 year span. Pennsylvania had 658,851 crude deaths in the last 5 years, 2013-2017.
Pennsylvania crude death rate increased significantly 34.7 points comparing recent 5 year crude death rate to prior 5, 2013-2017 versus 2008-2012 death rates = 1030.2 - 995.6 = 34.7 death rate point increase in the last 5 year period.
Calculation for Percent Change = ((New Value - Old Value)/ Old Value )*100 = 4.2% = Pennsylvania ((2013-2017 Crude deaths - 2008-2012 Crude deaths ) / (2008-2012 Crude deaths ))*100 = ((658,851 - 632,056) / ( 632,056))*100 = ((26,795) / ( 632,056))*100 = 4.2%

Rhode Island had a 4.1% crude death increase - - 1,970 more crude deaths in the last 5 year span versus prior 5 years, 2013-2017 versus 2008-2012 = 49,617 - 47,647 = 1,970 more crude deaths in the last 5 year span. Rhode Island had 49,617 crude deaths in the last 5 years, 2013-2017.
Rhode Island crude death rate increased significantly 34.5 points comparing recent 5 year crude death rate to prior 5, 2013-2017 versus 2008-2012 death rates = 939.9 - 905.4 = 34.5 death rate point increase in the last 5 year period.
Calculation for Percent Change = ((New Value - Old Value)/ Old Value )*100 = 4.1% =
Rhode Island ((2013-2017 Crude deaths - 2008-2012 Crude deaths ) / (2008-2012 Crude deaths ))*100 = ((49,617 - 47,647) / ( 47,647))*100 = ((1,970) / ( 47,647))*100 = 4.1%

South Carolina had a 13.1% crude death increase - - 27,183 more crude deaths in the last 5 year span versus prior 5 years, 2013-2017 versus 2008-2012 = 234,805 - 207,622 = 27,183 more crude deaths in the last 5 year span. South Carolina had 234,805 crude deaths in the last 5 years, 2013-2017.
South Carolina crude death rate increased significantly 61.9 points comparing recent 5 year crude death rate to prior 5, 2013-2017 versus 2008-2012 death rates = 958.8 - 897. = 61.9 death rate point increase in the last 5 year period.
Calculation for Percent Change = ((New Value - Old Value)/ Old Value )*100 = 13.1% = South Carolina ((2013-2017 Crude deaths - 2008-2012 Crude deaths ) / (2008-2012 Crude deaths ))*100 = ((234,805 - 207,622) / ( 207,622))*100 = ((27,183) / ( 207,622))*100 = 13.1%

South Dakota had a 6.8% crude death increase - - 2,425 more crude deaths in the last 5 year span versus prior 5 years, 2013-2017 versus 2008-2012 = 38,178 - 35,753 = 2,425 more crude deaths in the last 5 year span. South Dakota had 38,178 crude deaths in the last 5 years, 2013-2017.
South Dakota crude death rate increased 12.8 points comparing recent 5 year crude death rate to prior 5, 2013-2017 versus 2008-2012 death rates = 889.6 - 876.8 = 12.8 death rate point increase in the last 5 year period.
Calculation for Percent Change = ((New Value - Old Value)/ Old Value )*100 = 6.8% = South Dakota ((2013-2017 Crude deaths - 2008-2012 Crude deaths ) / (2008-2012 Crude deaths ))*100 = ((38,178 - 35,753) / ( 35,753))*100 = ((2,425) / ( 35,753))*100 = 6.8%

Tennessee had a 11.2% crude death increase - - 33,407 more crude deaths in the last 5 year span versus prior 5 years, 2013-2017 versus 2008-2012 = 332,590 - 299,183 = 33,407 more crude deaths in the last 5 year span. Tennessee had 332,590 crude deaths in the last 5 years, 2013-2017.
Tennessee crude death rate increased significantly 65.4 points comparing recent 5 year crude death rate to prior 5, 2013-2017 versus 2008-2012 death rates = 1007.5 - 942. = 65.4 death rate point increase in the last 5 year period.
Calculation for Percent Change = ((New Value - Old Value)/ Old Value )*100 = 11.2% = Tennessee ((2013-2017 Crude deaths - 2008-2012 Crude deaths ) / (2008-2012 Crude deaths ))*100 = ((332,590 - 299,183) / ( 299,183))*100 = ((33,407) / ( 299,183))*100 = 11.2%

Texas had a 12.6% crude death increase - - 105,304 more crude deaths in the last 5 year span versus prior 5 years, 2013-2017 versus 2008-2012 = 942,821 - 837,517 = 105,304 more crude deaths in the last 5 year span. Texas had 942,821 crude deaths in the last 5 years, 2013-2017.
Texas crude death rate increased significantly 23.2 points comparing recent 5 year crude death rate to prior 5, 2013-2017 versus 2008-2012 death rates = 688. - 664.7 = 23.2 death rate point increase in the last 5 year period.
Calculation for Percent Change = ((New Value - Old Value)/ Old Value )*100 = 12.6% =
Texas ((2013-2017 Crude deaths - 2008-2012 Crude deaths ) / (2008-2012 Crude deaths ))*100 = ((942,821 - 837,517) / ( 837,517))*100 = ((105,304) / ( 837,517))*100 = 12.6%

Utah had a 16.9% crude death increase - - 12,471 more crude deaths in the last 5 year span versus prior 5 years, 2013-2017 versus 2008-2012 = 86,367 - 73,896 = 12,471 more crude deaths in the last 5 year span. Utah had 86,367 crude deaths in the last 5 years, 2013-2017.
Utah crude death rate increased significantly 41.5 points comparing recent 5 year crude death rate to prior 5, 2013-2017 versus 2008-2012 death rates = 576.1 - 534.6 = 41.5 death rate point increase in the last 5 year period.
Calculation for Percent Change = ((New Value - Old Value)/ Old Value )*100 = 16.9% = Utah ((2013-2017 Crude deaths - 2008-2012 Crude deaths ) / (2008-2012 Crude deaths ))*100 = ((86,367 - 73,896) / ( 73,896))*100 = ((12,471) / ( 73,896))*100 = 16.9%

Vermont had a 9.6% crude death increase - - 2,548 more crude deaths in the last 5 year span versus prior 5 years, 2013-2017 versus 2008-2012 = 29,097 - 26,549 = 2,548 more crude deaths in the last 5 year span. Vermont had 29,097 crude deaths in the last 5 years, 2013-2017.
Vermont crude death rate increased significantly 81.4 points comparing recent 5 year crude death rate to prior 5, 2013-2017 versus 2008-2012 death rates = 930.4 - 849. = 81.4 death rate point increase in the last 5 year period.
Calculation for Percent Change = ((New Value - Old Value)/ Old Value )*100 = 9.6% = Vermont ((2013-2017 Crude deaths - 2008-2012 Crude deaths ) / (2008-2012 Crude deaths ))*100 = ((29,097 - 26,549) / ( 26,549))*100 = ((2,548) / ( 26,549))*100 = 9.6%

Virginia had a 9.3% crude death increase - - 27,790 more crude deaths in the last 5 year span versus prior 5 years, 2013-2017 versus 2008-2012 = 326,943 - 299,153 = 27,790 more crude deaths in the last 5 year span. Virginia had 326,943 crude deaths in the last 5 years, 2013-2017.
Virginia crude death rate increased significantly 34.1 points comparing recent 5 year crude death rate to prior 5, 2013-2017 versus 2008-2012 death rates = 781.2 - 747.1 = 34.1 death rate point increase in the last 5 year period.
Calculation for Percent Change = ((New Value - Old Value)/ Old Value )*100 = 9.3% = Virginia ((2013-2017 Crude deaths - 2008-2012 Crude deaths ) / (2008-2012 Crude deaths ))*100 = ((326,943 - 299,153) / ( 299,153))*100 = ((27,790) / ( 299,153))*100 =
9.3%"

Washington had a 10.2% crude death increase - - 24,883 more crude deaths in the last 5 year span versus prior 5 years, 2013-2017 versus 2008-2012 = 269,722 - 244,839 = 24,883 more crude deaths in the last 5 year span. Washington had 269,722 crude deaths in the last 5 years, 2013-2017.
Washington crude death rate increased significantly 24.4 points comparing recent 5 year crude death rate to prior 5, 2013-2017 versus 2008-2012 death rates = 751.4 - 726.9 = 24.4 death rate point increase in the last 5 year period.
Calculation for Percent Change = ((New Value - Old Value)/ Old Value )*100 = 10.2% =
Washington ((2013-2017 Crude deaths - 2008-2012 Crude deaths ) / (2008-2012 Crude deaths ))*100 = ((269,722 - 244,839) / ( 244,839))*100 = ((24,883) / ( 244,839))*100 = 10.2%"

West Virginia had a 4.4% crude death increase - - 4,789 more crude deaths in the last 5 year span versus prior 5 years, 2013-2017 versus 2008-2012 = 112,789 - 108,000 = 4,789 more crude deaths in the last 5 year span. West Virginia had 112,789 crude deaths in the last 5 years, 2013-2017.
West Virginia crude death rate increased significantly 59.2 points comparing recent 5 year crude death rate to prior 5, 2013-2017 versus 2008-2012 death rates = 1226.5 - 1167.3 = 59.2 death rate point increase in the last 5 year period.
Calculation for Percent Change = ((New Value - Old Value)/ Old Value )*100 = 4.4% =
West Virginia ((2013-2017 Crude deaths - 2008-2012 Crude deaths ) / (2008-2012 Crude deaths ))*100 = ((112,789 - 108,000) / ( 108,000))*100 = ((4,789) / ( 108,000))*100 = 4.4%

Wisconsin had a 8.2% crude death increase - - 19,463 more crude deaths in the last 5 year span versus prior 5 years, 2013-2017 versus 2008-2012 = 256,077 - 236,614 = 19,463 more crude deaths in the last 5 year span. Wisconsin had 256,077 crude deaths in the last 5 years, 2013-2017.
Wisconsin crude death rate increased significantly 55.6 points comparing recent 5 year crude death rate to prior 5, 2013-2017 versus 2008-2012 death rates = 887.7 - 832.1 = 55.6 death rate point increase in the last 5 year period.
Calculation for Percent Change = ((New Value - Old Value)/ Old Value )*100 = 8.2% =
Wisconsin ((2013-2017 Crude deaths - 2008-2012 Crude deaths ) / (2008-2012 Crude deaths ))*100 = ((256,077 - 236,614) / ( 236,614))*100 = ((19,463) / ( 236,614))*100 = 8.2%

Wyoming had a 7.5% crude death increase - - 1,634 more crude deaths in the last 5 year span versus prior 5 years, 2013-2017 versus 2008-2012 = 23,450 - 21,816 = 1,634 more crude deaths in the last 5 year span. Wyoming had 23,450 crude deaths in the last 5 years, 2013-2017.
Wyoming crude death rate increased significantly 28.5 points comparing recent 5 year crude death rate to prior 5, 2013-2017 versus 2008-2012 death rates = 803.7 - 775.2 = 28.5 death rate point increase in the last 5 year period.
Calculation for Percent Change = ((New Value - Old Value)/ Old Value )*100 = 7.5% = Wyoming ((2013-2017 Crude deaths - 2008-2012 Crude deaths ) / (2008-2012 Crude deaths ))*100 = ((23,450 - 21,816) / ( 21,816))*100 = ((1,634) / ( 21,816))*100 = 7.5%

Alaska had a 14.8% crude death increase - - 2,745 more crude deaths in the last 5 year span versus prior 5 years, 2013-2017 versus 2008-2012 = 21,346 - 18,601 = 2,745 more crude deaths in the last 5 year span. Alaska had 21,346 crude deaths in the last 5 years, 2013-2017.
Alaska crude death rate increased significantly 54.3 points comparing recent 5 year crude death rate to prior 5, 2013-2017 versus 2008-2012 death rates = 578.2 - 523.9 = 54.3 death rate point increase in the last 5 year period.
Calculation for Percent Change = ((New Value - Old Value)/ Old Value )*100 = 14.8% = Alaska ((2013-2017 Crude deaths - 2008-2012 Crude deaths ) / (2008-2012 Crude deaths ))*100 = ((21,346 - 18,601) / ( 18,601))*100 = ((2,745) / ( 18,601))*100 = 14.8%
*******************************************************************
This report includes all deaths, Crude death is a measure of all death for a specified period and age group.
This report includes all deaths, Crude death is a measure of all death for a specified period and age group.
*******************************************************************
Source:
Centers for Disease Control and Prevention, National Center for Health Statistics. Dataset: Underlying Cause of Death. 1999-2017 on CDC WONDER Online Database, released December, 2018. Data from the Multiple Cause of Death Files, 1999-2017, as compiled from data provided by the 57 vital statistics jurisdictions through the Vital Statistics Cooperative Program. CDC source data, but not a CDC publication. Data Accessed at http://wonder.cdc.gov/ and https://wonder.cdc.gov/ucd-icd10.html
Group By: State; Ten-Year Age Groups
Copyright information
Permission is given to print and share this report to support education and health of people, free of charge. When you share or print, suggested citation includes source, facebook page and blog.
Resources –Seeking Help
Medical Emergency Call 911
National Suicide Prevention Lifeline http://www.suicidepreventionlifeline.org
National Suicide Prevention Lifeline 1-800-273-TALK
National Suicide Prevention Lifeline 1-800-273-8255
National Suicide Prevention Lifeline for Deaf & hard of hearing 1-800-799-4889
If You Suspect your child is using drugs http://www.drugfree.org/intervene
Treatment Locator – National listing by SAMHSA and Referral Hotline (SAMHSA) 1-877-SAMHSA-7a
Veteran’s and their Families. http://www.veteranscrisisline.net/Resources/SpreadTheWord.aspx
Veteran’s and their Families Call: 1-800-273-8255
How Much is Too Much? https://www.rethinkingdrinking.niaaa.nih.gov/How-much-is-too-much/Whats-the-harm/What-Are-The-Risks.aspx
24 Hour Toll Free Prayer Lines
Daystar 1-800-329-0029
Catholic prayer hotline TBD
National Prayer Center Assemblies of God 1-800-477-2937
Christian Broadcasting Network (700 Club) 1-800-759-0700
Common Ground: (248) 456-8144
Responsibility:
Young people are a blessing and are made to live. Losing young people in the land in which we live is devastating, we must never forget those we lost and keep moving forward to prevent the next generation from stumbling into this situation.
When young deaths rise, a critical situation is occurring, as responsible citizens, we can find ways to support critical populations, support the young, elderly and the lowly. We can investigate what is happening, have any laws changed in an area that could affect the health of people.
Greatest Commandment: Matthew 22:35-40
35 Then one of them, which was a lawyer, asked him a question, tempting him, and saying, 36 Master, which is the great commandment in the law? 37 Jesus said unto him, Thou shalt love the Lord thy God with all thy heart, and with all thy soul, and with all thy mind. 38 This is the first and great commandment. 39 And the second is like unto it, Thou shalt love thy neighbor as thyself. 40 On these two commandments hang all the law and the prophets.
Contact:
If you would like to join us in supporting good health of all people call 248-392-8676 or email hismatter@gmail.com or join us at
Understanding death increase enables residents to understand critical populations to work on solutions and give support. Living in Grace created these reports to improve the health and well-being of persons living in the United States.
Living in Grace Page https://www.facebook.com/livinginGracematters/